Collecting and analysing data to understand microgrid performance is essential for informing effective maintenance schedules, business planning and technical designs for future microgrids. It can also inform policy interventions and help build a knowledgebase to accelerate the microgrid sector both nationally and globally.
Commissioned in July 2020, the Mthembanji solar microgrid has been collecting data through smart meters and remote monitoring devices for over 10 months. An objective of EASE is to utilise project learning to inform the microgrid sector in Malawi, specifically through analysis and sharing of data.
This blog provides an overview of how data on revenue, demand and technical performance data is being collected, as well as some insight into what the data is telling us about how the microgrid is performing. Following a full year of analysis in Q3 of 2021 we intend to publish a deeper dive into the technical and economic performance of the microgrid, as well as an update on the social impact monitoring and evaluation – watch this space!
Why is microgrid data important?
Many solar microgrid projects have faced sustainability challenges due to insufficient maintenance or inefficient business models due to a lack of quality data collection and analysis. Microgrids that implement innovative smart metering and remote monitoring address these challenges, allowing developers to make informed decisions to ensure systems are operating at optimum economic and technical efficiency in order to remain financially and practically viable. Analysing data also helps to fine-tune existing business models, by informing tariffs to ensure access to electricity is affordable for microgrid customers, while still maintaining sufficient income to be financially viable, offering confidence for potential investors. Perhaps most importantly, data analysis can help inform the technical design of other microgrids and therefore has the potential for impact on multiple sites.
Data visualisation and sharing also enables funders, investors, researchers, and policymakers to monitor and understand microgrid performance, allowing use of the data to inform policy, investments, targeted research and other interventions in the microgrid enabling environment to accelerate their deployment. In short, data analysis enables better informed and more efficient microgrid deployment, accelerating energy access and contributing to achieving SDG7.
What data are we measuring?
Alongside information related to the wider EASE project monitoring and evaluation framework, data is being collected from the microgrid in themes of technical, economic, and social impact, summarised below:
- Technical Data: relating the to the functionality of the generation and distribution systems, a variety of data on technical performance is being collected through remote monitoring of the PV, batteries and inverters, along with measurements and observations of the system collected through scheduled maintenance visits on site.
- Demand and Economic Data: Smart meters log income, payment frequencies and energy use for customers, allowing for insight on business revenue, load profiles, peak load, connection status and individual customer data. Operational expenses are monitored and tracked to inform business planning.
- Social Impact data: A Key Performance Indicator framework is being used to track data relating to the impact the microgrid is having on the community, in themes such as health and education, employment and finance, and female empowerment. This data is collected through in person surveys and will be the subject of a separate blog. You can see the baseline findings here.
How are we collecting data?
Smart meters
Developed by SteamaCo, each connection at Mthembanji has a smart meter which produces real-time data on parameters including revenue generation, demand, payment frequency, and connection status. Data is available though an online user interface, spreadsheet downloads, or through an API. We’ve developed python code utilising panda libraries to allow for raw data retrieval and transformation into a data frame for easier analysis.

Generation system remote monitoring
The SMA Sunny Portal gathers technical data on the PV, batteries and inverters, and displays it through an internet portal which enables system operators and researchers to monitor and configure systems and to visualize system data. The data parameters available through the system are outlined in the table below, all logged at 5 minute intervals and available for weekly or daily download through an FTP Push protocol. Data monitoring choices can be adapted based on microgrid operator needs, and email alert functionality is available if required.

| Data Parameter | units |
| AC Power | W |
| AC Reactive Power | (var) |
| AC Apparent Power | VA |
| AC Voltage | (V) |
| AC Current | (A) |
| Grid Frequency | (Hz) |
| DC Voltage | (V) |
| DC Current | (A) |
| DC Power | (W) |
| Insulation Resistance | (Ohm) |
| Specific AC Power | W/Wp |
What have we found out so far?
Gathering field data from actual microgrid customers and system performance is providing invaluable research insight for the of the EASE project, with detailed academic papers and policy briefs in the pipeline. Data collection, storage and analysis frameworks have been developed to gain insight on the information the data is providing. Below is a snapshot of some key parameters being revealed and what they mean for the microgrid business and technical design.
Daily Energy Balance
The figure below shows a typical daily energy balance; displayed through the SunnyPortal including battery state of charge, discharge battery energy, direct consumption, internal power supply, total consumption and total generation. It can be seen that from midnight to 7am (sunrise) the battery state of charge steadily decreases as night time loads of internal and security lighting and other household loads are being used. From 7am to 11am, the battery state of charge increases as the PV modules are powered by the sun, with the battery reaching full state of charge by around 11am.
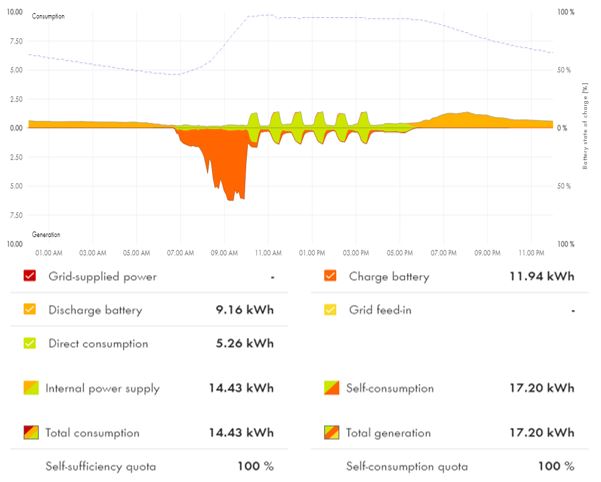
The regular bumps of direct consumption throughout the day are caused by the air conditioner cooling cycling within the shipping container to maintain a suitable temperature for the batteries. Some additional daytime power is used by productive uses within the community, but are minimal. At 6pm the sun goes down and domestic users switch on lights and other domestic loads, which can be seen as a rise in the battery discharge and a steady reduction in battery state of charge. Analysis of the daily energy flows can reveal the following:
- The battery state of charge finishes the night at around 50%. This suggests additional capacity can be utilised at night. The design lower state of charge for the batteries is 20%, which suggests there is 30% of 19.2kWh available for additional night-time loads.
- The batteries are fully charged by around 11am, and direct consumption during daylight hours is minimal, indicating there is significant scope for additional daytime use.
Weekly Energy balance
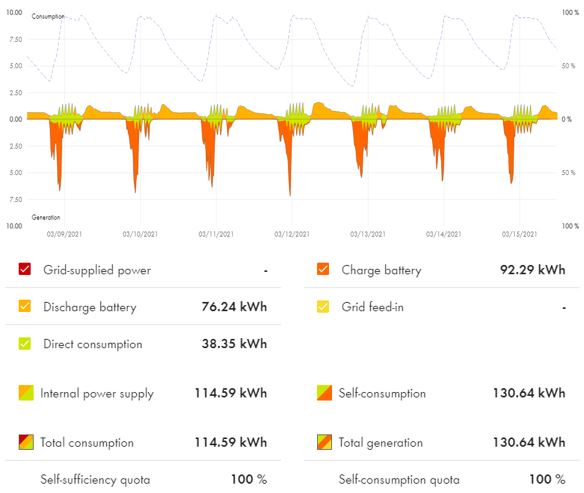
A similar chart showing a typical weekly balance is shown below, again viewed through the SunnyPortal. It can be seen that on some days the battery state of charge goes below 50% and depending on weather conditions, the batteries reach full state of charge at different times throughout the morning, with more cloudy days shown by a more jagged rise, and a later time to reach full state of charge. Monthly and annual views are available to explore seasonal patterns in energy generation and consumption.
Utilisation Factor
The utilisation factor is a ratio of how much energy is used as a proportion of how much is theoretically available. To determine theoretical yield from the PV plant, Renewables Ninja was used which allows users to run simulations of the hourly power output from solar power plants located anywhere in the world. The inputs and calculations for this process are summarised in the table below. A csv file with theoretical hourly energy production from the PV plant is summed to provide the total annual theoretical production. Annual demand (scaled to 12 months from 10 months of available Steamaco data) is then divided by the annual theoretical production to obtain the utilisation factor.
| Parameter | Value |
| Location of the microgrid | -14.246680, 34.605612 |
| Capacity of the generation | 11.52 kW |
| System loss as a fraction | 0.1 |
| Tracking | none |
| Dataset | MERRA-2 (global) |
| Tilt | 15 degrees |
| Azimuth | 180 degrees |
| Annual theoretical yield | 20,528 kWh |
| Annual Demand | 4,265 kWh |
| Utilisation Factor | 21% |
The utilisation factor of 21% for the microgrid is noticeably low, indicating there is significant excess energy available in the system going to waste. A key challenge for any microgrid developer is to increase the utilisation factor to increase profitability and reduce tariffs for customers. At Mthembanji, the plan is to address this through increased daytime productive uses of energy in the agricultural value chain.
Microgrid Load Profiles
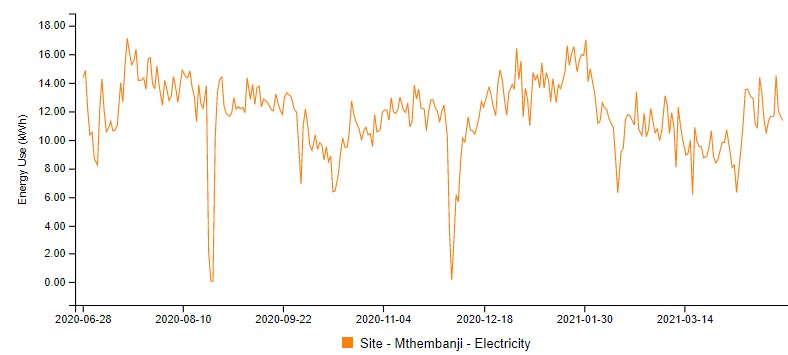
Load profiles are important to analyse how much power the entire system is using across a given timeframe. The figure below shows the daily energy use for the microgrid since installation. The mean total average energy use is 11.68 kWh per day, with a max of 17 kWh per day.
Below is the total load profile on an hourly basis for the whole microgrid for a given day. It follows a typical domestic demand, with a large peak of almost 1.5 kW in the evening due to domestic lighting loads. Load profiles like this are essential for technical design and can be used for modelling system size of future microgrids. It also allows for an understanding of night-time use to size batteries, and day time use to estimate excess power available in the system.
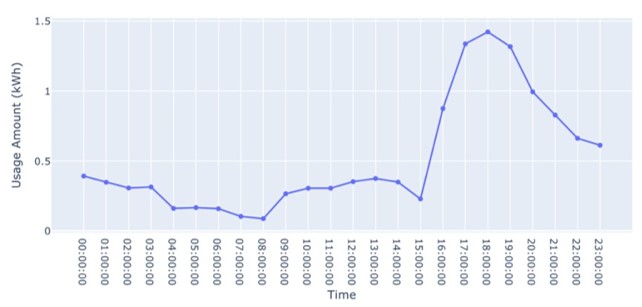
Another view, below, shows load profile for a selected day for an average customer, derived by dividing each point on the graph above by the total number of customers. This graph shows energy use for an average customer, repeating the process for different customer segments (domestic, businesses, institutions) will allow for more detailed load planning for system design.
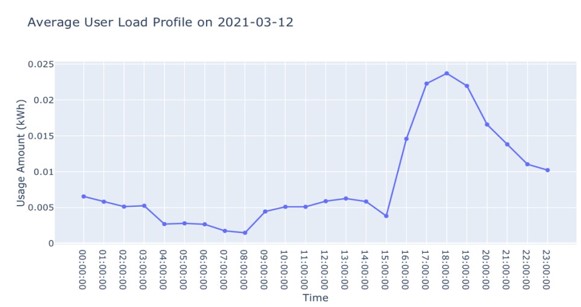
The charts above allow observations in usage variations throughout the day, and enables better understanding of demand to inform future microgrid designs by providing insight into appropriate PV, battery and inverter sizing. Furthermore, by comparing this data with system performance and daily/weekly energy balances enables analysis to be undertaken into how much energy is being wasted and whether tariffs could be altered accordingly in order to encourage increased usage.
What’s happening next?
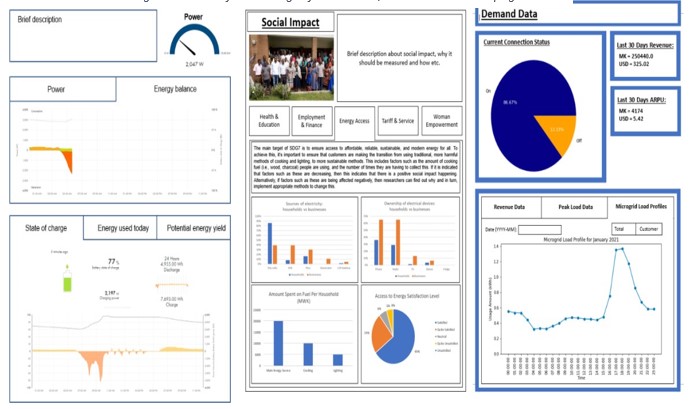
Based on progress made in data collection and analysis so far, a prototype online data visualisation platform is being developed to enable quicker, more efficient analysis of data to inform future microgrid designs. The online dashboard will also enable funders, researchers, and other stakeholders to continuously monitor the performance of the microgrid, as well as a platform for United Purpose and Strathclyde to use to assist with operations, maintenance and business model development. Ultimately, it is hoped the platform will ensure the microgrid is running at optimum economic and technical efficiency in order to remain financially and practically viable, while also informing future microgrid designs.
The insight and results gained so far are currently being used to inform the design of the next EASE microgrid, to be installed in 2021. Specifically, having measured load profiles as well as demand surveys will increase the accuracy of design through accurate component sizing and helping to reduce costs. Demand and revenue data are also proving invaluable in updating business modelling assumptions, and will inform wider business models for a solar microgrid social enterprise operating a fleet of microgrids nationally across Malawi.
This analysis is a first look at an ongoing process to refine and increase technical efficiency and financial viability of microgrids in Malawi. The objective is to highlight the need for good data management and analysis practices, and encourage other microgrid developers to collect, analyse and share data from their sites. Data sets and further analysis will be available through the EASE project, intended to be of utility to policy makers, researchers and practitioners in the drive to accelerate energy access in Malawi through increased deployment of solar microgrids towards achieving SDG7.