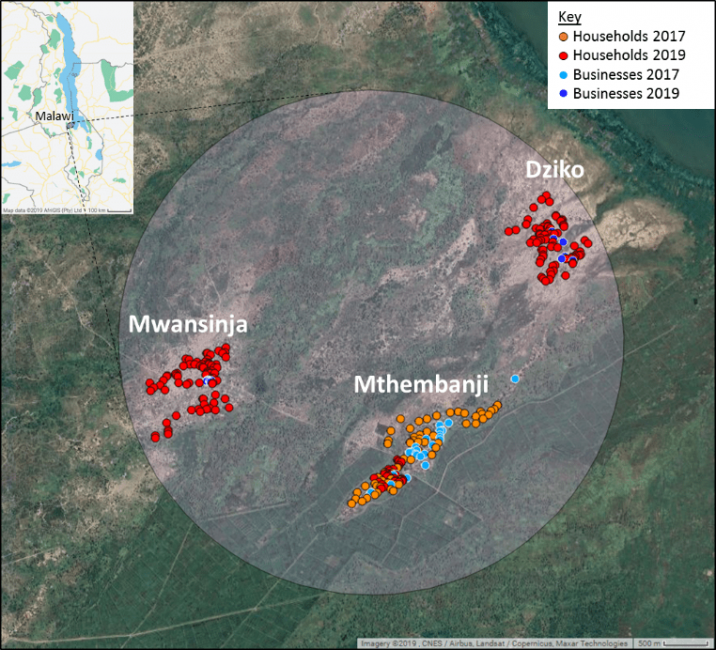
The EASE monitoring and evaluation strategy includes tracking the SDG7 impact in each community where a microgrid or energy hub is deployed. In addition, microgrid ‘customer journeys’ will be documented. To support these aims, a baseline survey was carried out for households and businesses in Mthembanji (Dedza district) in February 2019. The responses were combined with data from a similar exercise carried out in 2017, including two other satellite villages (Mwansinja and Dziko), resulting in a dataset of 281 households and 47 businesses. Analysis provided valuable baseline information including several key areas described below under the headings of: occupations and expenditures, electrical appliances and sources of energy, and cooking fuels and devices. Cross-analysis of the variables demonstrated some additional findings which are described in the final section.
The baselining activity helped to inform microgrid design decisions including electrical capacity and tariff setting.
Key Findings
Occupations and Expenditures
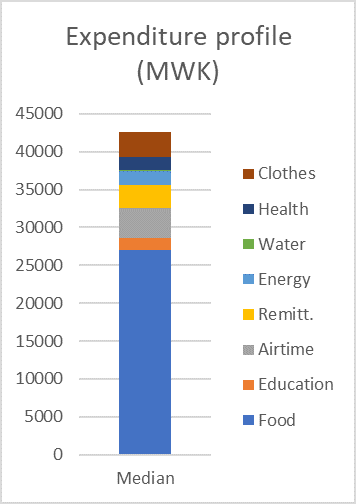
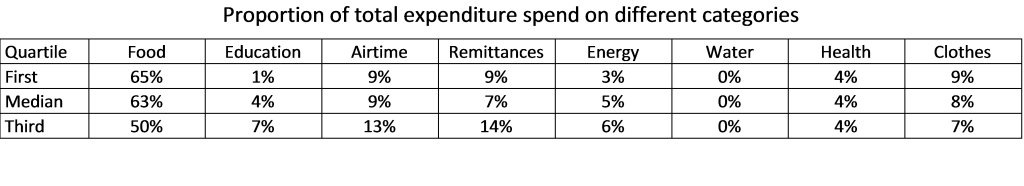
Food was by far the largest household expenditure (50-65% of total monthly expenditure). Energy was a comparatively small expenditure (3-6% of total monthly expenditure).
Mthembanji and the surrounding villages were predominantly farming communities (89%) with many also selling primary goods such as crops and fish (62%).
Electrical appliances and sources of energy
For the majority of households of households, dry cell batteries were the only source of electricity (78%) which were predominantly used to power torches which were the main source of lighting for a large proportion of households (85%). However, a 22% of households had some renewable energy generation through pico-solar products and/or solar home systems.
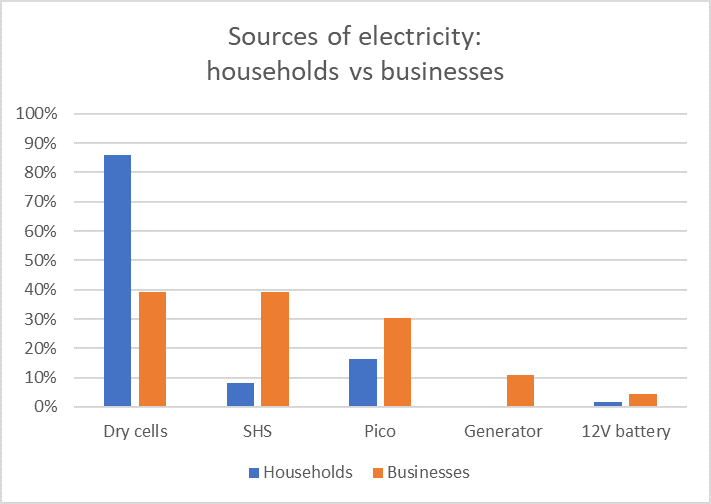
With households relying so heavily on dry cell batteries, their electrical appliance and device ownership was very low; 36% had a mobile phone and just 29% had a radio.
Businesses’ energy sources were very different, 39% had solar home systems and 30% had pico-solar products – solar was the main source of lighting for 63% of businesses. The proportion of businesses using dry cell batteries was less than half that of households (30%). Five businesses owned generators.
Phone and radio ownership was double the level reported by households (phones and radio both 65%).
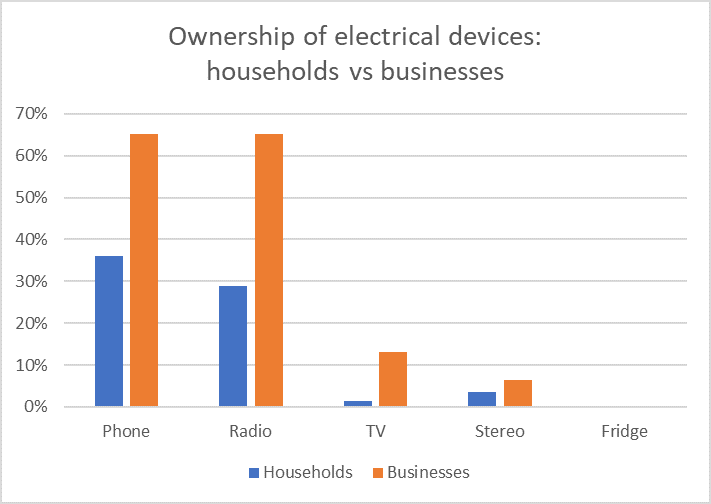
Similar proportions of households and businesses aspired to own a selection of electrical devices, of which fridges and TVs were the most popular. Households also wished to own radios, but when asked what they would use microgrid electricity for, lighting was the most popular choice, selected by over 5 out of 6 respondents.
Cooking fuels and devices
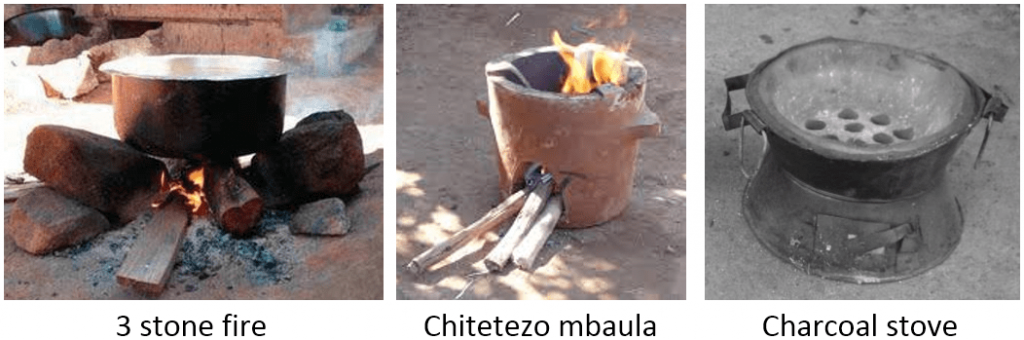
All households cooked with biomass, with almost all households using firewood with a traditional three stone fire (92%), some using a basic clay firewood stove (chitetezo mbaula, 9%) and some using charcoal (12%).
Cross-analysis findings
Battery use vs ownership of solar home systems and pico-solar products
In households with solar home systems the likelihood of using dry cell batteries was half the overall levels (43% vs 86%) and the median number of batteries used per month was also smaller (9 vs 12). Households with pico-solar products were also less likely to use dry cell batteries (63% vs 86%) but had similar levels of battery usage. This suggests that solar home systems may be effective in transitioning users away from dry cell batteries, while pico-solar products may not.
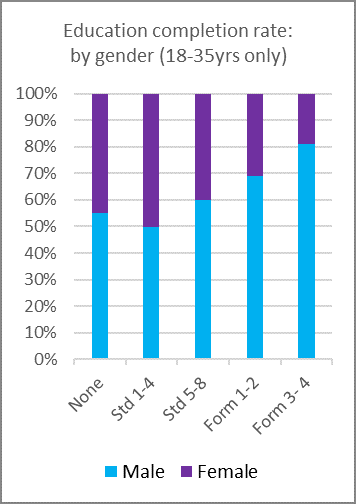
Education levels of different demographics
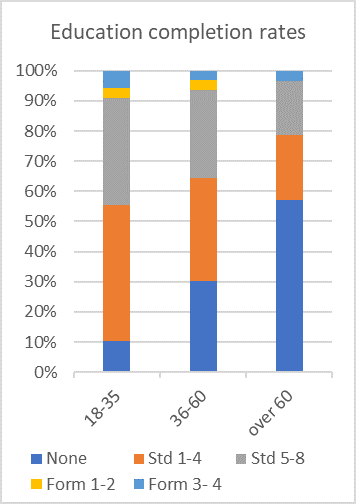
The proportion of people without any education was significantly lower in younger adults, which appears to be due to increases in the proportion having completed the first and second halves of primary school.
Similarly, the smallest gender gap in education was in the youngest age group, while the gap increased through the higher age groups. Education above primary school level could not be analysed across age groups due to small sample sizes.
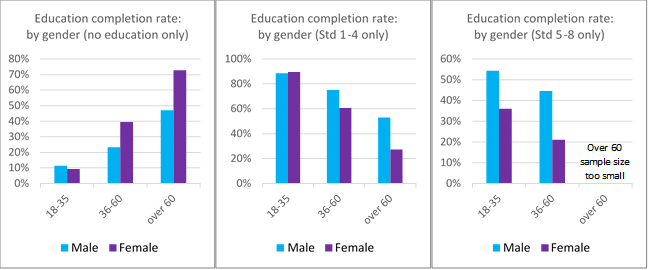
For the 18-35yrs age group, the sample was sufficiently large to compare across all education levels. Similar levels of 18-35-year-old males and females had no education or had completed standard 1-4. However, the gap steadily increased at education levels above standard 4; for example in the 18-35yrs age group, just 1 female for every 4 males had completed secondary school.
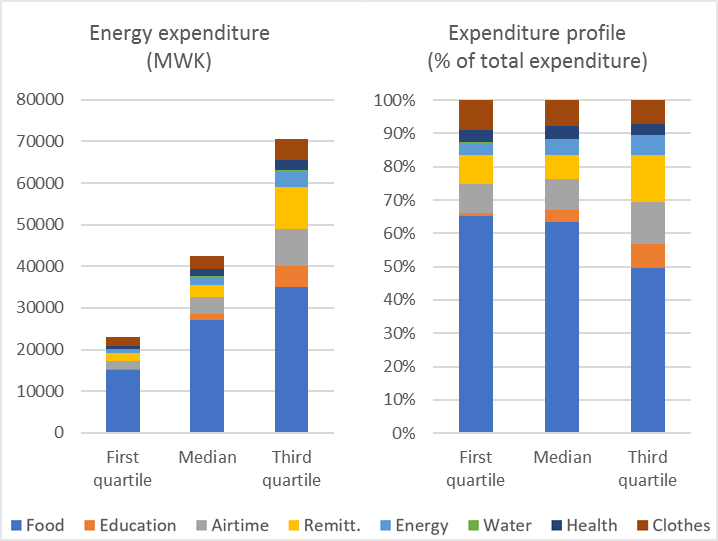
Expenditure profile variation with total household expenditure
By comparing the expenditure profiles of the first, median, and third quartiles it appears that households with lower total expenditures spend a higher proportion on food than households with higher total expenditures. This difference appears to be largely filled by households with higher total expenditures spending a larger proportion on education, airtime and remittances.
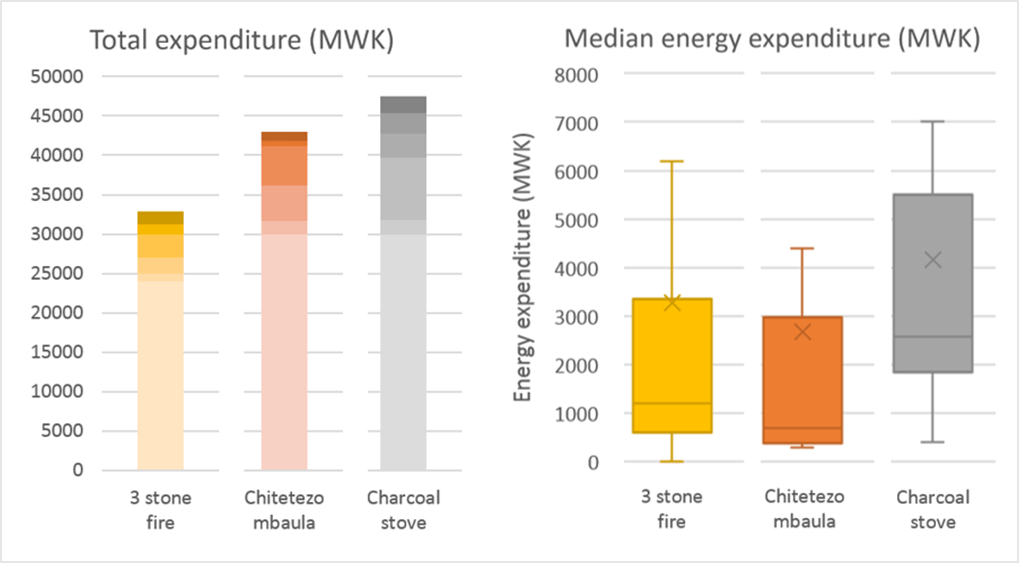
Cooking devices and household finances
Comparing household expenditure with the cooking devices used, suggests that (as might be expected) those who use 3 stone fires have the lowest total household expenditure. Those using basic clay stoves have higher total expenditures (31% higher than 3 stone owners) and those using charcoal stoves have even higher expenditures (45% higher than charcoal owners).
However, this is not simply due to higher energy expenditure. In fact, those using chitetezo mbaulas have the lowest energy expenditure (likely due to fuel efficiency savings).