Since it’s installation the Mthembanji microgrid has been collecting valuable data on technical, economic and social impact performance through smart meters, remote monitoring and enumerator surveys. With this data, a team of students at Strathclyde University have developed a data visualisation platform as part of the Solar Microgrids for Sustainable Development VIP4SD project. The tool enables monitoring and evaluation of data to understand microgrid performance, ultimately informing business strategies for scaling microgrid operations in Malawi. Data is collected through third party APIs and analysed through python, currently hosted on the heroku platform which allows free hosting. A description of how the data is collected and the analysis presented on the platform is outlined below, access the tool here: http://ease-microgrid.herokuapp.com/
Data collection frameworks
Smart Meter data utilises the SteamaCo platform, which offers an innovative solution to monitor energy use, lets people pay for power using their mobile phones, and quickly troubleshoots problems. SteamaCo’s mobile-enabled smart meter, bitHarvester, collects real-time data on revenue, demand and smart meter uptime, accessed through the cloud and presented on the platform.
Remote monitoring data on generation and storage system is logged through the Sunnyportal, an online portal offered by SMA which enables mini-grid system operators and researchers to monitor and configure PV generation systems and to visualize system data. Data is logged at 5 minute intervals and available for weekly or daily download.
Battery temperature is tracked through a custom built temperature logger to track internal and external temperatures, logged at 10 minute intervals and exported to a cloud platform via the sites 3G wifi network. The temperature data logger was developed at Loughborough University, UK[1]
Social Impact surveys tracking ‘customer journey’ were conducted by United Purpose enumerators with all microgrid customers, through smart phones using kobocollect. Surveys uploaded to kobocollect’s online platform are downloaded for analysis as spreadsheets. Following a baseline survey prior to microgrid installation, two follow up surveys have been completed.
Data analysis
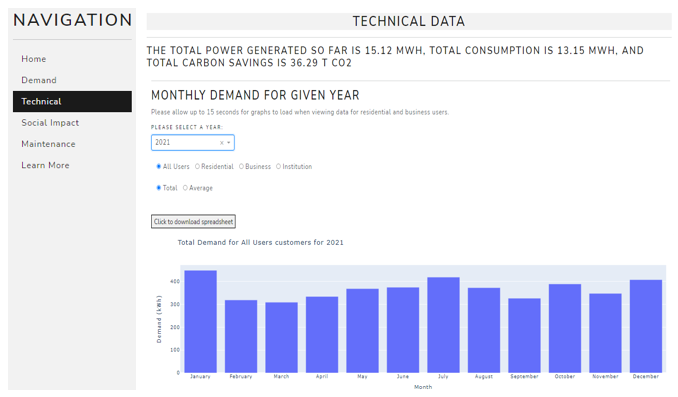
Technical Indicators relate to performance of the generation system taken mainly through the Sunny portal API. These include PV generation, inverter consumption, battery temperature, system downtime, and system efficiency. Carbon savings are calculated following the UNFCCC methodology for mini-grids.
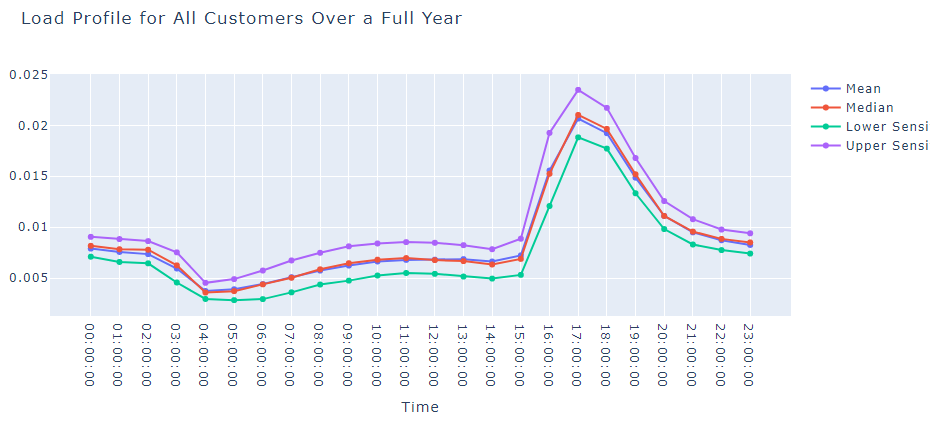
Demand Indicators include revenue, monthly demand and hourly load profiles. A detailed spreadsheet containing hourly load profiles for an entire year (8760 data points) is available for download, showing the mean, median and quartile load profiles for single customer segments (residential, business and institutional) as well as the whole microgrid. These load profiles show measured energy use for previously unconnected customers and offer a valuable aid to mini-grid design.
Social Impact indicators, from analysis of enumerator surveys show responses to questions asked of customers on the impact the microgrid has on their quality of life in in terms of household finances, education, health and communication, and the impact on female community members.
Each indicator has a description of where the data came from and an option to download the data as a spreadsheet.
Using the tools and next steps
The data analysis presented through the tool is intended to deepen understanding of the current microgrid’s performance. Lack of data on microgrid performance, sustainability and social impact is recognised as a barrier to scaling up microgrids, mini-grids and other Decentralised Renewable Energy infrastructure in Malawi. It is intended that this platform will help in removing these barriers, through improving technical design and business models as well as informing policy. Findings also contribute to the business and operational planning concerned with future microgrids deployed by United Purpose as part of the EASE project.
As a beta version, the tool may be slow to load for some indicators, please be patient! Any feedback on the tool including functionality and content would be welcome (aran.eales@strath.ac.uk). The development of the platform will continue through another student project in the next academic year (2022/2023), with improvements planned such as increasing the speed of access and incorporating data from the next microgrid, soon to be installed.
[1] under work funded through Innovate UK Energy Catalyst Round 6: Project Number 10528, Productive Use of DC Solar Power in Africa to Improve Quality of Rural Life. Project team Dr Matt Little and Dr Richard Blanchard Further details can be found at https://www.lboro.ac.uk/research/crest/research/groups/re-for-development/facilities/