- Measuring and tracking social impact is essential for informing microgrid business models
- EASE has developed a robust set of Key Performance Indicators to monitor the impact the microgrid is having on the community
- Initial surveys have been conducted revealing insight on the microgrid social impact
- An online tool to visualise social impact data alongside technical and economic data is under development
Microgrids have the potential to be a key factor in achieving SDGs in rural communities. Providing sustainable energy access (SDG7) can underpin socio-economic development (e.g. improved health, education, welfare, and employment). Understanding this social impact is essential to inform the business model and technical design of the microgrid to contribute its ongoing sustainability.
The EASE project has developed a robust monitoring and evaluation toolkit for understanding the programme’s wider impact. The toolkit draws on our own research and learning from across the sector to define detailed methods for measuring the social impact of the microgrid. Key Performance Indicators are being used to track what effect the microgrid is having on the customers it is providing electricity for, allowing a deeper understanding of how the microgrid is affecting the customers and wider community, which in turn informs the microgrid technical operation and business planning. This blog intends to describe the data that is being collected, share some insights from analysis of initial data, and discuss what this means for future microgrid deployment.
Why measure social impact?
Currently, a paucity of evidence exists on the social impact of microgrids, minigrids and other decentralised energy solutions (especially in Malawi), and measuring it enables researchers and practitioners to gain insight to inform positive interventions. Measuring social impact offers transparent reporting on the overall performance of a project, it provides opportunities for new social investors to be attracted, as well as informing what additional measures can be undertaken to aid the project’s efficiency. This enhances trust and accountability within an organisation, to its funders and beneficiaries through communication of data driven evidence which in turn informs operational decisions to increase positive impact.
Social impact analysis is also beneficial to the wider microgrid sector as it provides a simple, robust, and effective way to collect real-time data on the impact that the solar microgrid has on the communities where they are implemented. Such data can be analysed to inform business models and support future microgrid designs by providing quantitative and qualitative data that can be linked with economic and technical information, allowing for a thorough understanding of system performance, ultimately resulting in quicker and more efficient deployment of solar microgrids.
Social impact data analysis also makes it easy for current and potential donors and investors to understand impact from microgrids which can encourage future project financing. Through continued support from donors and investment to accelerate microgrid deployment, energy access and associated economic development in rural areas empowers communities and aids progress towards achieving SDG7.
How is social impact measured?
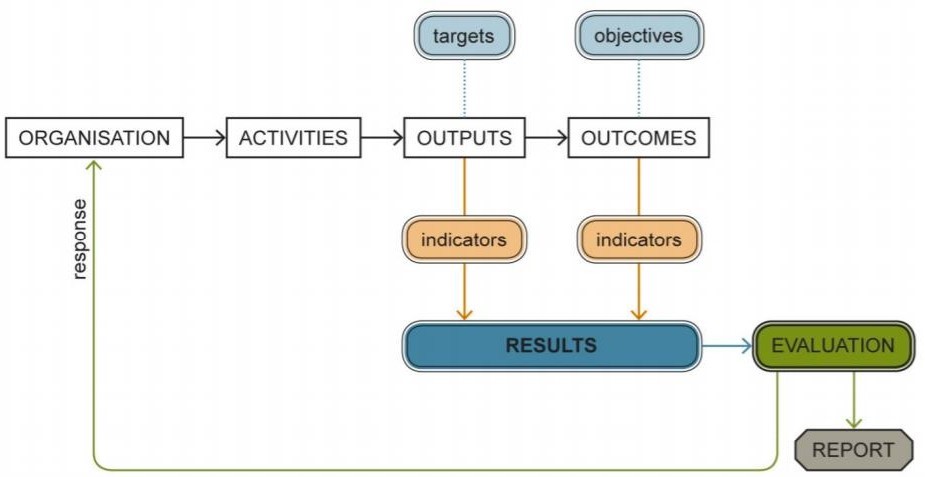
A ‘Theory of Change’ addresses key changes a project or organisation wants to make (in this case deployment of a solar microgrid), identifying all possible outcomes, outputs and activities that must be undertaken in order to achieve this goal. Data collection informs progress towards outcomes, implemented through customer surveys. Quantitative data analysis compares performance with targets to track and monitor project achievements and progress, while qualitative data analysis captures anecdotal and descriptive information used to provide feedback to system operators and stakeholders. For the Mthembanji microgrid, we are referring to the process of monitoring as tracking customer journeys.
Identifying Indicators
Key Performance Indicators (KPIs) are used to monitor the progress of the activities, related to themes within the Theory of Change. The KPI themes chosen for the Mthembanji Microgrid are outlined below, along with some example indicators.
| KPI Theme | Example Indicator |
| Energy Access | Number of connections, Electricity consumption (demand) |
| Health and Education | Cases of respitory illness, Access to information |
| Employment and Finance | Household income, Number of jobs created by the microgrid |
| Women Empowerment | Female free time |
| Tariff and Service | Satisfaction with Tariff |
Data collection and analysis
Accurate qualitative and quantitative data is gathered from the community through surveys conducted by field enumerators, using smart phones utilising the digital data collection platform KoboToolbox. The method is simple and robust, optimises time in the field and minimises risk of data loss.
A baseline survey provides a detailed indication into levels of energy access and social demographics before the project, with follow up surveys carried out periodically (ideally every 6 months). Quantative data is analysed using standard statistical methods, outlined below.
| Statistical Analysis | Utility |
| Mean | Average value, useful for tracking KPIs at a high level |
| Median | Middle value, giving insight on data skew |
| Standard Deviation and Variance | Measure of dispersion – low value indicated spread is closer to the mean, high value the data is more spread out |
| Quantiles | First and third quartiles (<25% and >75%) indicating the spread of the data |
Some Early Results
The baseline survey was carried out in August 2019, the microgrid was installed in July 2020 and a customer journey survey was conducted in May 2021. Given the survey was completed only 10 months after the microgrid was installed, there is limited time for change to occur. Despite this, initial results below show areas where social impact is already being experienced by the customers.
Results from the first survey can be briefly summarised as follows: Customers are significantly happier with their more modern, stable energy source and most would recommend it to a friend; however, they also feel that the price of electricity is too high and they would like to be able to use a greater ranger electrical appliances. This creates a positive challenge for the microgrid business model; continue enhancing the level of service and drive down costs, whilst maintaining sufficient revenue for financial sustainability.
Demographics
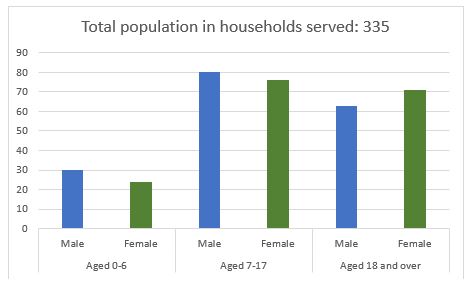
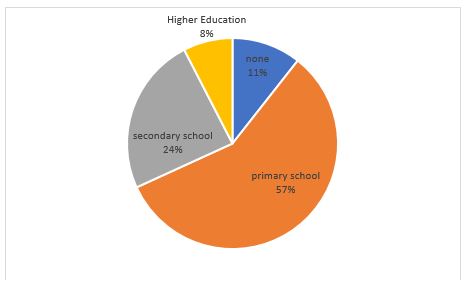
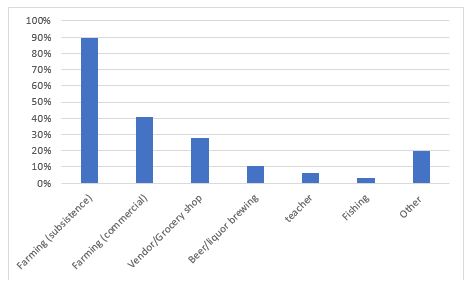
There are 60 registered customers, of which 58 are households and 2 are only businesses. Of these, the average household size is 5.98, and the microgrid serves a total of 335 people in households (173M, 171F). There is a high number of children, with 210 under the age of 18. Most customers have finished primary school, with 24% finishing secondary school, and 8% attending higher education, with 11% having no formal education. The vast majority of households are farmers, with some also running grocery shops, or brewing, and some teachers.
Source of Electricity
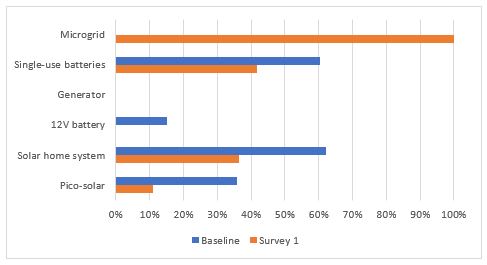
100% of the respondents are now using the microgrid as their main source of electricity, resulting in the use of other electricity sources decreasing. Single-use battery usage has reduced from 60% to 42%, the number of households using Solar Home Systems (SHS) has changed from 62% to 36%, pico-solar usage has reduced from 36% to 11%, and finally, 12V battery usage has changed from 15% down to 0%.
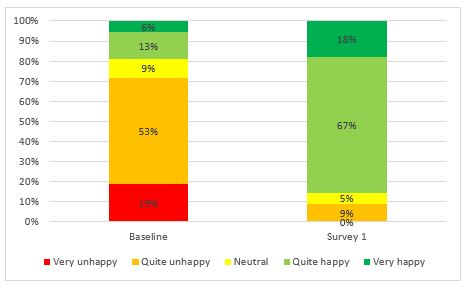
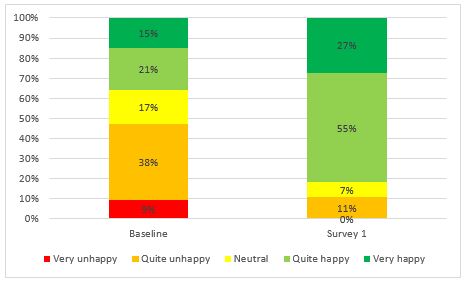
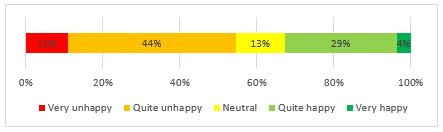
Overall, customers are much happier with their current access to energy, with no respondents stating they felt “very unhappy” with their access to energy, compared to “19%” reported on the baseline survey.
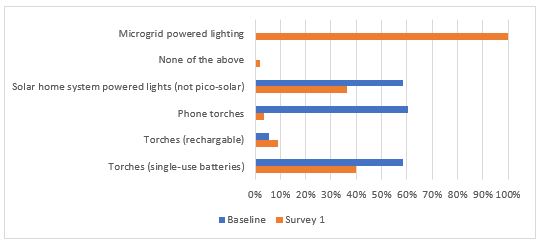
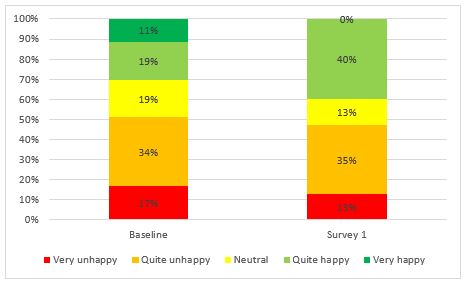
The main source of lighting within the community has changed from phone torches to microgrid powered lighting. In the baseline survey, 58% of the community used SHS and single-use battery torches and this number decreased to 36% and 40% respectively. Although phone torches were the main source of lighting in the baseline survey, it is now the least used method with only 4% of the community making use of this, compared to the prior 60%.
As a result of the fixed lighting that is provided through the microgrid, the overall response in relation to lighting satisfaction increased throughout the community.
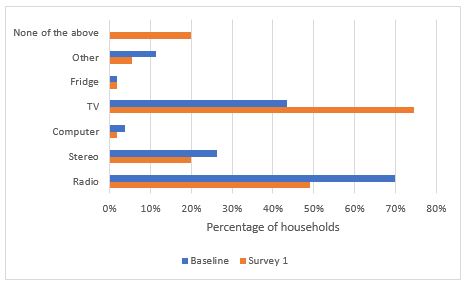
Appliance Ownership
TVs ownership has increased by 32%, with 75% of households now making use of these, while interestingly other electrical appliances such as computers (2%), stereos (20%), and radios (49%) have seen a decrease in ownership. The level of satisfaction from the baseline compared to the first follow-up survey has remained relatively similar.
Employment and Finance
Since the installation of the microgrid, an additional 9 businesses have started, including grocery shops with refrigeration, a computer café, video shows, tearoom and barbershops. Currently 16% of the households use the microgrid connection for income-generating activities.
Tariff and Service
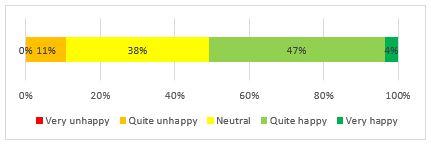
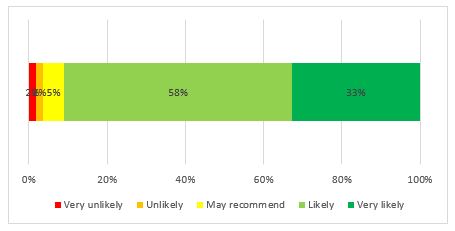
Customers are generally happy with the method of paying for electricity, however they are generally discontent with the tariff themselves. Despite this, a vast majority (98%) would recommend the microgrid to a friend.
What does this mean for the microgrid?
The initial insight provide some interesting findings. Judgements on social impact within the community since the installation of the microgrid are difficult given the short timescales within the survey was completed. Evidence of social impact can be seen in that customers generally felt a lot happier with their current access to energy, particularly feeling more satisfied with their home lighting and the ability to entertain or perform work/study activities within their households at night.
However, the microgrid has not yet been able to impact the income aspect for households despite providing the opportunity to start new businesses. Furthermore, although the microgrid has provided households with improved lighting and the ability to upgrade information/entertainment sources from radio to TV, it still does not meet all of the desired energy needs – more lighting and use more electrical appliances. Another overall feeling about the microgrid was that electricity continues to be too expensive, and for some households it is even more expensive than previous energy sources so the implementation of altered tariffs will be necessary. The expectation is that as the microgrid continues to provide customers with electricity and people gain more knowledge on how to use it for income generating activities, whether that be within their households or to start new businesses, the impact will continue to grow. This is being addressed by the project through development of flexible tariffs, capacity building within the community, and implementing productive uses of energy on the microgrid to stimulate economic development.
Following the next survey to be conducted in January 2022, a more detailed paper will be published providing further insight into the social impact of the microgrid. Meanwhile, the results and analysis gathered so far will continue to improve the business model towards and affordable and sustainable solution to energy provision in rural areas that can be scaled nationally.
Next steps: visualising social impact data
A visualisation platform that enables these three data types to be displayed on a single interface is in development. This will be beneficial to the microgrid sector as it provides a simple, robust, and effective way to collect real-time data on the impact that the solar microgrid has on the communities where they are implemented. As the platform is the first data collection tool that targets the social impact of microgrids in Malawi, it provides an insight into the impact and the potential that they have. The tool can be used as a framework that can be deployed to inform business models and support future microgrid designs by providing quantitative and qualitative data that can be linked with economic and technical information, allowing for a thorough understanding of system performance. This results in the ability to deploy solar microgrids more rapidly and more efficiently.
The tool will also makes it easy for current and potential donors to see the impact that is being made which can encourage them to fund projects. Through continued support from donors, more job opportunities can continue to be created in these rural communities which empowers them to gain the socio-economic ability to move out of poverty. The framework is also not restricted to microgrid projects in Malawi. It provides a framework that can be used on sustainable energy systems around the world, which is essential in combating SDG7.
Thanks to University of Strathclyde student Andrew Taylor who contributed to this blog building on his internship with EASE